
Hashrate per Watt: The Ranking Metric Miners Ignore
A ranking table tells you what a machine earns per day, not what it keeps. A 500 TH/s rig running at 20 J/TH draws 10 kW and burns 240 kWh a day — roughly $14.40 of power at $0.06/kWh — against $18.24 of daily income after the listed 4% fee, at today's difficulty and a BTC price of $84,692. Run that same 500 TH/s at 30 J/TH and the power bill becomes $21.60, which is more than the hardware earns.

Key takeaways
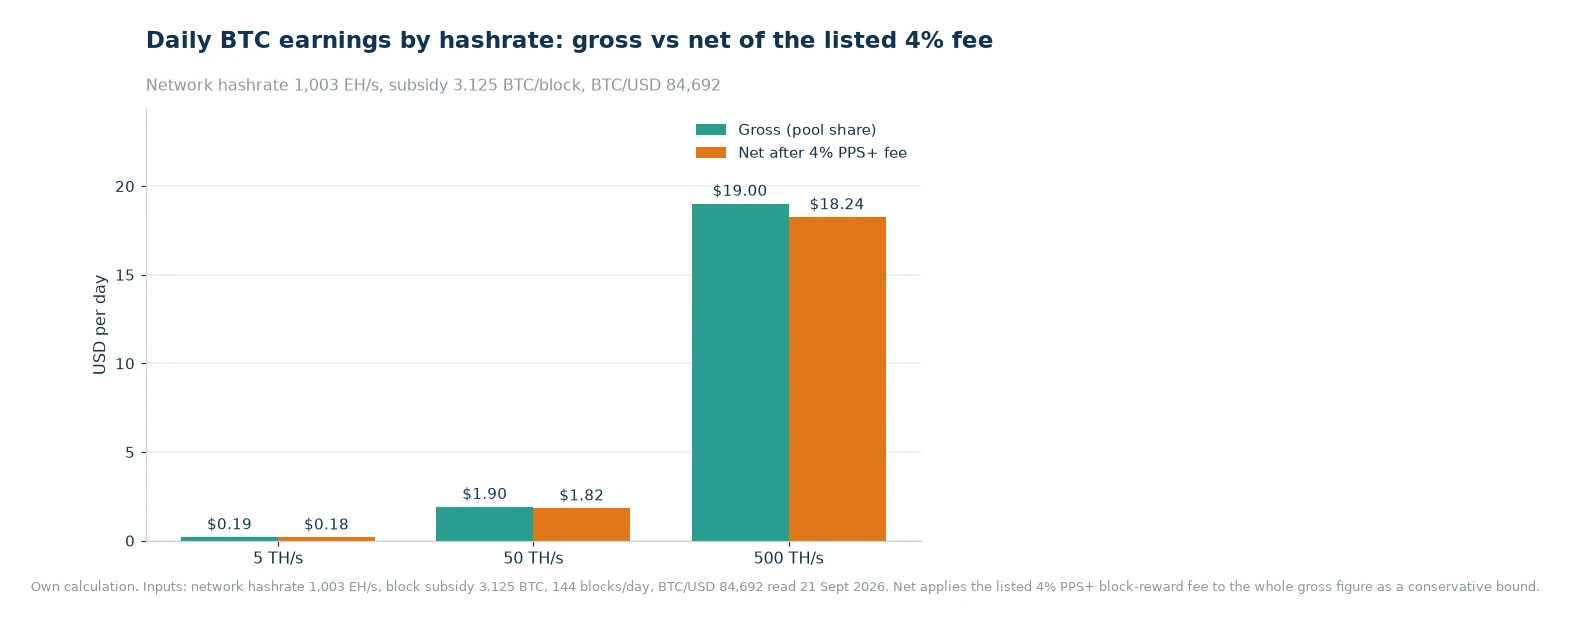
- At a network hashrate of 1,003 EH/s and a $84,692 BTC price, 500 TH/s produces 0.000224 BTC a day: $19.00 gross and $18.24 after the listed fee.
- Hashrate per watt decides whether that $18.24 survives: the same 50 TH/s clears $0.74 a day at 15 J/TH and loses $0.34 a day at 30 J/TH once power is paid at $0.06/kWh.
- Ranking figures are quoted at the current price and difficulty and cannot include your tariff, uptime or cooling, so read them as a ceiling rather than a forecast.
- Re-run the sum after every difficulty adjustment: the −2.12% change estimated on 21 September 2026 would lift an unchanged machine's daily output by about 2.2%.
Why the numbers move
Daily mining income rests on three inputs: your hashrate as a share of the network, the value of the block subsidy plus transaction fees, and the coin's market price. The arithmetic is short — your hashrate divided by network hashrate, multiplied by the 450 BTC the network issues each day, multiplied by one minus the pool fee.[1] Notice what is missing from that line: watts. That omission is why a ranking board can be perfectly accurate and still lead you to a machine you should not run.
Two of the three inputs are outside your control and both move quickly. Difficulty is designed to rise as hashrate joins the network, and the estimate read on 21 September 2026 pointed to a −2.12% adjustment — a reminder that it travels in both directions. The sensitivity is symmetrical and easy to hold in your head: a 10% rise in difficulty cuts your share of the same reward pool by about 9%, and a 10% fall in price does the same thing to the value of the coins you already earned.
Efficiency is the one lever you choose. It acts on the cost side of a ledger the ranking never prints. Two machines with the same sticker hashrate can differ by a factor of two in power draw, and electricity is the only mining cost that arrives every day whether the pool finds blocks or not.
What changes your payout
Hashrate is half the story. How the pool converts shares into money is the other half. Two payment methods are published on the ViaBTC pricing page: PPS+ is the default, settling the block-reward component per share at a listed 4% fee while the transaction-fee component is distributed with PPLNS logic at a listed 2% fee; PPLNS merges block rewards and transaction fees under a single listed 2% fee and leaves reward variance with the miner.[1]
Which component the fee lands on matters more than the headline percentage. The 4% is charged on the slice of income the pool pays regardless of its own luck, which is why it is the higher number: PPS+ takes pool-luck and orphaned-block risk off your books and charges for it. The 2% is charged on a part of the payout that is usually small in normal conditions. Reading PPS+ as a flat 6% haircut on everything is the single most common error in pool comparisons, and the published fee breakdown exists because that flattening keeps happening.[2]
Settlement cadence is the second lever. PPS+ pays every hour based on current difficulty. PPLNS distributes after a block reaches six confirmations, weighted by each miner's share of pool hashrate across the last five difficulty rounds. Hourly settlement does not improve your expected income — it changes when that income arrives, which is a working-capital question rather than a yield question.
Projections are only as good as the inputs you are allowed to change, so use a tool that lets you set your own tariff and assumed uptime. The profit calculator takes coin price, difficulty, PPS fee rate and effective hashrate and returns estimated daily earnings, merged-mining output included.[3]
Worked example
Start with a 500 TH/s machine at 20 J/TH. It draws 10 kW, which is 240 kWh a day, and at $0.06/kWh that electricity costs $14.40. Its gross output at 1,003 EH/s of network hashrate is 0.000224 BTC a day, worth $19.00 at $84,692, and $18.24 once the listed 4% fee is applied to the whole gross figure — a deliberately conservative treatment, since the listed fee applies to the PPS-settled block-reward component rather than to every part of the payout. After power, $3.84 a day is left.
Now hold the hashrate fixed and change only the efficiency. A 30 J/TH unit of the same 500 TH/s draws 15 kW, or 360 kWh a day, and pays $21.60 for the electricity that produces the same $18.24. The margin is negative $3.36. At 15 J/TH the draw falls to 7.5 kW, the bill to $10.80, and the margin rises to $7.44. Nothing about the network changed — only the watts did.
| Efficiency level | Power draw | Power cost per day at $0.06/kWh | Net income per day after the listed fee | Margin per day |
|---|---|---|---|---|
| 30 J/TH | 1.50 kW (36.0 kWh) | $2.16 | $1.82 | −$0.34 |
| 20 J/TH | 1.00 kW (24.0 kWh) | $1.44 | $1.82 | +$0.38 |
| 15 J/TH | 0.75 kW (18.0 kWh) | $1.08 | $1.82 | +$0.74 |
The identical hashrate produces identical revenue in all three rows, and the outcome swings from a loss to a positive margin on power alone. Scale the same arithmetic out and the effect is easier to see in absolute terms: a 10 PH/s farm built on 20 J/TH hardware draws about 200 kW, which is 4,800 kWh a day and roughly $288 of electricity at $0.06/kWh, against about $380 a day of gross mining income at current difficulty.
What to check monthly
A monthly review is enough. The inputs that decide the margin move slowly enough that daily checking produces noise, and quickly enough that yearly checking produces surprises.
- Realised hashrate against sticker hashrate. A board that reports per-worker hashrate shows whether a machine is drifting below its rated figure before the revenue drop shows up in a payout.
- Effective cost per kWh, all in. Tariff plus hosting plus any cooling overhead. The break-even price is simply net daily revenue divided by daily kWh, and it is the number to compare against your invoice.
- The difficulty trend. One adjustment either way is noise; three in the same direction is a change in the economics of every machine you own.
- Which component your fee touched. Track the block-reward and transaction-fee parts of a payout separately, because a change in average transaction fees shows up in only one of them.
- The board itself. The ViaBTC Miner Ranking lists what each model earns at live price and difficulty, which is the fastest way to see whether a unit you already own is worth switching on.[4] Pair it with the mining statistics page, where pool hashrate, network hashrate and miner counts are published per coin.
Frequently asked questions
Is a bigger pool always better?
Size reduces payout variance but also concentrates hashrate. What matters more is fee structure, uptime, latency and payout cadence.
What happens if my miner goes offline?
Shares stop, so expected income stops with them. Alerts and a dashboard that shows per-worker hashrate shorten the gap between a failure and a fix.
Put watts on the dashboard
Add a fourth column to whatever spreadsheet you use for mining: joules per terahash, or its close cousin, cost per kilowatt-hour at which the machine stops paying for itself. Divide net daily revenue by daily power consumption once a month and compare the result with your actual tariff — if the two numbers are within a cent, the machine is one difficulty adjustment away from running at a loss. Ranking tables are a good starting filter for which hardware to look at; the efficiency figure is what decides whether you keep it plugged in.
Data and sources: ViaBTC pricing and fee documentation[1][2], the profit calculator[3], the miner ranking board[4] and on-chain difficulty data. Network hashrate (1,003 EH/s), difficulty (132.76 T), the 3.125 BTC block subsidy and the BTC price of $84,692 were read on 21 September 2026. Figures are illustrative, use a $0.06/kWh power price, and change with difficulty and market price.